Simulating road traffic
The simulation of road traffic is one of the first use cases of computers: it assists the work of road and city planners since the 1960s. The increasing rate of urbanization, and the developments in the mathematical models and computer hardware spawned simulations in ever increasing size and complexity. New simulation systems appeared that can model the participants of the traffic on different scales ranging from a single crossroad to a country-wide network.
MATSim
MATSim is an open source traffic simulation system. It was developed in Java, and it can be extended by the user with new modules also written in Java. Over time several such extensions have been made part of the standard distribution.
This framework simulates the behavior of agents over a given network. All the parameters of the system van be tuned: the goals, preferences and opportunities of the users, the road network, and the properties of various traffic modes. Using the numerous available extensions we can model the effect of communication on the traffic, various catastrophes, or even the first day of a zombie apocalypse. MATSim simulates the daily routine of the participants: one iteration lasts for 24 hours. The framework uses a series of such 24 hour iterations to adjust the behavior of the users to the traffic network and the additional constraints. To do this first we have to define the opportunities for all users: can they leave from home earlier or later, do they take the children to school, do they go shopping in the lunch break or on the way home after work etc. After this the framework chooses a plan for the user for that day, simulates one day of the whole population, then evaluates the utility scores for the days, and ranks the plans based on the scores during the iterations. The simulation runs for a predetermined number of iterations, hopefully converging toward the global optimum.
In the Scenario Gallery there are a few examples of optimizing the traffic system of a city or a region using MATSim.
The short documentation of MATSim is available as a User Guide, a downloadable pdf. This is an excerpt from the big MATSim book (which was last updated in 2016), collecting the chapters that are most useful for beginner users. The figures in this syllabus are from another excerpt available on ResearchGate.

Input parameters
The two most important input parameters are the network and the population. The population contains the demands of the users, while the network contains the opportunities. During the simulation the system tries to satisfy the demands based on other input parameters, while observing the constraints.
The network can be a fictional graph, but it is also possible to import slices of a real road network from the Open Street Map database. In MATSim the network is stored as a directed graph. The coordinates of the nodes must be given in a Cartesian coordinate system. The roads are the edges of the graph, which should be at least as long as the coordinate difference between the end points, but they can also be longer.
The population demand is much harder to align with real life, because we would need to assign exact locations for the daily plan of each user individually. We would have to know where each user lives, where they go to work, where they go to shop, eat lunch etc. In addition, we should also know how much time they spend on those activities. Such data sets are only available to Google and Tencent, thus, we have to employ approximations based on some assumptions.
We also need to specify as part of the input parameters the utility values of the various traffic modes and activities, what strategy to employ when choosing from the available plans, and what replanning methods are permitted. These parameters must be given for the whole population, not for individual users.
Choosing a plan
The plans for a single user can be given in the configuration file, but in addition to this, the framework can derive new plans from the given ones. The framework chooses one of the available plans, and executes it for the day. We can specify in the configuration which plan we want to execute. In the first iteration all plans have equal probability to be chosen. In later iterations we have the scores resulting from using the plans, and we can base our plan selection on the scores reached in previous iterations. In the configuration we can specify which plan selection strategy should be employed with what probability. The available selection strategies are the following.
KeepLastSelected
Keeps the plan that was used in the last iteration.
BestScore
Reuses the plan that reached the highest score.
SelectExpBeta
Based on the scores it applies a complex model to assign probabilities to the plans, and then chooses randomly.
ChangeExpBeta
Same as SelectExpBeta, but instead of using the absolute scores, it computes the difference in score compared to the previous iteration.
SelectRandom
Chooses from the plans with equal probability.
Mobility simulation
The MATSim framework supports mobility models that have different degrees of complexity. The default mobility simulator is QSim, which is optimized for handling a large number of vehicles, and uses a flow-based approach. The model handles the topology on a link-level, the users reach their destination when they arrive at the link that is closest to the coordinates of their next activity, and they continue moving from that position when leaving for another activity. The basic unit of movement is also based on the link, the movement of the vehicles inside the link, like follow distance, changing lanes, or overtaking are not modeled by QSim, the simulator is only concerned by the events related to changing links. These link changes don't contain traffic control mechanisms. There are no traffic lights, every link simply has an output capacity, and the vehicles leave the link with this volume, regardless of the cross-traffic occurring on the network node, or the direction in which the vehicles continue moving. These simplifications allow QSim to model several hundred thousand vehicles at once.
A vehicle entering a link spends time on the link that is proportional to the length of the link before entering the queue of the vehicles exiting the link.

The output of the mobility simulation is the sequence of events handled by QSim. The contents of this depends on the model handled by QSim.
Scoring
After the simulation of the users is done, the evaluation of the iteration takes place. The evaluation is based on a utility-limit model. The utility reached by a user in the iteration is the sum of utilities reached in the activities performed during the day, plus the utility of the travel between these activities (in practice this decreases the utility, as traveling is not considered a useful part of the day).
Utility of an activity
The utility of an activity is defined by not only their length, but other parameters as well. Arriving earlier or later can incur penalties or bonuses, for example for waiting in the cold in front of a locked door, or the student can take a last glance at the lecture notes before the exam. In most cases being late is an undesirable event. Similarly, leaving early from an activity is also undesirable. As the utility of an activity is measured with a logarithmic function, a correction factor is added for abandoning an activity (for example going to the gym and leaving immediately after changing clothes is not particularly useful).
Since the system handles 24 hour cycles, the last activity of the day (typically being at home) is merged with the first activity of the day (also being at home). This is important, as the utility of an activity depends non-linearly on the time spent on the activity in one go. Spending 10 hours at home and sleeping uninterrupted is better than spending 5 hours twice, interrupted by doing something else.
Utility of traveling
The utility of traveling (in essence its cost) is determined by the distance and the method of travel. Since the distance and the one-time cost of the travel can expressed monetarily in most cases (e.g. buying gasoline or bus tickets), these cost factors appear explicitly in the system. The connection between utility and cost is linear in this model.
Replanning
At the end of the day the framework examines all users and assembles the set of plans, from which it can choose one for the next iteration. When assembling the new set of plans the framework can use different strategies to expand the set from the available plans. It can choose a plan and modify it, or it can even delete plans, if the number of plans exceeds the maximum number allowed by the configuration.
TimeAllocationMutator
Modifies a plan such that it shifts the start times randomly. The system is unable to modify the plan by changing the order of the activities (e.g. the user goes to the goes to the post office before or after going to the hair saloon), or to choose between alternative locations for an activity (e.g. shopping centers or sport fields). It cannot alter the plan by removing an activity, either.
ReRoute
It chooses a new route for the user to take when going from activity to activity. We also have to select a routing algorithm in the controller, which allows this change.
ChangeTripMode, ChangeSingleTripMode
These change the mode of travel. The ChangeTripMode strategy changes the used vehicle for the entire day, so the user will use only one type of vehicle. The ChangeSingleTripMode strategy only changes vehicle for a single travel between two activities (e.g. go to lunch and back). The latter can also take into account the availability of special vehicles, such as a bus.
Using MATSim
The MATSim framework consists of a Java application and its extensions. The easiest way of using it is through running scenarios defined in configuration files, and analysis of the results.
Configuration files
The configuration files are in XML format. The scenario is governed by a single file, which references the network and population files. The contents of a minimal configuration file:
<?xml version="1.0" ?>
<!DOCTYPE config SYSTEM "http://www.matsim.org/files/dtd/config_v2.dtd">
<config>
    <module name="network">
        <param name="inputNetworkFile" value="./network.xml" />
    </module>
    <module name="plans">
        <param name="inputPlansFile" value="./plans.xml" />
    </module>

    <module name="controler">
        <param name="outputDirectory" value="./output" />
        <param name="firstIteration" value="0" />
        <param name="lastIteration" value="0" />
    </module>
    <module name="planCalcScore" >
        <parameterset type="activityParams" >
            <param name="activityType" value="home" />
            <param name="typicalDuration" value="12:00:00" />
        </parameterset>
        <parameterset type="activityParams" >
            <param name="activityType" value="work" />
            <param name="typicalDuration" value="08:00:00" />
        </parameterset>
    </module>
</config>
To evaluate the plans referenced in the above configuration file we need at least the following extra information: the nominal duration of the activities. In the population descriptor we need to use same names (home, work) for the activities, so that the framework can bind them.
<?xml version="1.0" encoding="utf-8"?>
<!DOCTYPE network SYSTEM "http://www.matsim.org/files/dtd/network_v1.dtd">
<network name="square network">
    <nodes>
        <node id="1" x="-40000" y="-40000"/>
        <node id="2" x="40000" y="-40000"/>
        <node id="3" x="40000" y="40000"/>
        <node id="4" x="-40000" y="40000"/>
    </nodes>
    <links capperiod="01:00:00">
        <link id="1" from="1" to="2" length="80000.00" capacity="36000" freespeed="27.78" permlanes="1" />
        <link id="2" from="2" to="3" length="80000.00" capacity="36000" freespeed="27.78" permlanes="1" />
        <link id="3" from="3" to="4" length="80000.00" capacity="36000" freespeed="27.78" permlanes="1" />
        <link id="4" from="4" to="1" length="80000.00" capacity="36000" freespeed="27.78" permlanes="1" />
    </links>
</network>
The second configuration file is the network description. Here we specify the nodes and the directed edges connecting the nodes. For a two-way connection we need to add both directions as separate links. The parameters of a link are its capacity (how many vechicles can leave it within a capperiod), the length of the link in meters, the maximum speed on the link in m/s, the number of lanes, and of course the source and destination node.
Finally, the file describing the population. The example below describes only a single user, not a category of users. Every single user has to have its own entry in this file.
<?xml version="1.0" ?>
<!DOCTYPE plans SYSTEM "http://www.matsim.org/files/dtd/plans_v4.dtd">
<plans>
    <person id="1">
        <plan>
            <act type="home" x="-40000" y="-40000" end_time="06:00"/>
            <leg mode="car">
            </leg>
            <act type="work" x="40000" y="40000" dur="08:00" />
            <leg mode="car">
            </leg>
            <act type="home" x="-40000" y="-40000" />
        </plan>
    </person>
</plans>
This user has only one plan, it leaves its home at 6, and works for 8 hours. Although we could compute the optimal split of time to be spent at home and at work from the utility values specified in the config, we have to also specify the planned duration in the plan, otherwise MATSim can't run the simulation.
The coordinates of the locations of the activities don't have to be exactly on network nodes, but it is important to specify points that are reachable by the road network.
Once the configuration files are ready, we need to run the simulation with the MATSim GUI. This is the class that is chosen by default in the runnable JAR of MATSim. In the GUI we need to load the configuration file, and click run. The simulation run can be followed in the log window.
After a successful simulation run the framework creates an output directory. This contains all the information processed by the simulator: the configuration files, the run times, the scores reached, and the distances travelled. The outputs of the individual iterations are placed into the ITERS directory. This contains the events during the run, and time diagrams about the use of various travel methods.
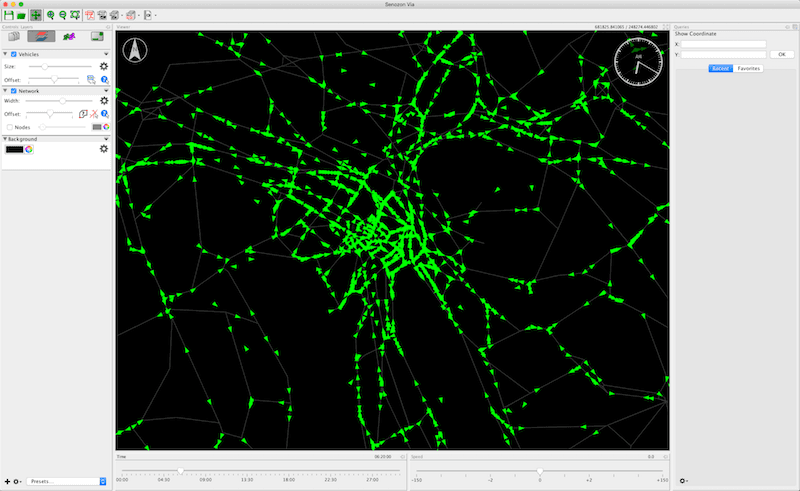
Visualizing the results
The simulation can be visualized in two ways. The OTFVis program shows the results while the simulator is running, while the Via program can play back the results of a completed simulation run, accelerated, or slowed down. Via is a considerably expensive software, however, it can be used with a free license with up to 500 simulated users. Via not only animates the movements of the users, but it can also show their plans.
When first starting Via it asks for a valid license. Everybody has to apply for one from the licenses page. The license.xml.zip file received in email must be downloaded into the VM, and supplied in the dialog window, then click on the Close button.
After starting Via the results of the simulation must be added one-by-one from the output directory. The events and plans can be found in the directories belonging to the iterations. We need to import the network (network.xml.gz) and the events (ITERS/it.0/0.events.xml.gz) into Via: either File > Add data or on the left pane select the data sources (three gray sheets), and drag&drop from the file manager.
After this we need to add the layers to the display. File > Add layer, and in the dialog Network, here it automatically fills the source field if the network was loaded correctly, then Add at the bottom. Now the network should be visible in the main window, we can zoom with the mouse wheel etc. Once again File > Add layer, in the dialog Vehicles from Events, and Add again. Now in the left pane select the layers (three colored sheets), and in the Vehicles part Load data. Now the timeline slider should become active, and we can set the time with it. We can also set a playback speed. When the last event of the day is reached, it automatically restarts the day from the beginning.
If we want to see the results of another simulation run in Via, we can remove the loaded data, and load the new ones, but sometimes it's faster to just close and restart Via.